
BizDb's financial section comprises economic data on every limited company registered in the UK. The assistance to understanding these professional terms is provided below in order to render the resource even more transparent and useful for you.
To understand most of the information in the financial part of a company's page, the terms "assets" and "liabilities" need to be explained first. As far as assets are concerned, they include all the resources of a particular company. Several types of assets are distinguished: fixed, current, tangible and intangible ones. When it comes to the first two, fixed assets are those which cannot be consumed or sold within the next fiscal year. These are usually the equipment, the machinery, the office space, buildings or other tools enabling the company to earn money. The assets which can be sold or consumed within a year are called the company's current assets. These are, for example, cash held by the company, tax refunds, money received from individuals, other companies or the government, but also the equipment and inventory that can be used up within one year. As for the distinction between tangible and intangible assets, these are the physical and immaterial (copyrights, trademarks, etc.) properties of a company, respectively.

The value of assets should be assessed depending on the value of the company's fixed and current liabilities, i.e. everything that the company owes to others. In a well functioning business, the total amount of assets should be higher than the total amount of its liabilities and the larger the gap between the two, the better (provided that this gap has a positive value). The difference between the assets and liabilities is called a company's net worth or its net assets and if its value is below zero, it means that the company is insolvent, i.e. cannot pay its dues. While checking the company's solvency, it is important to take into account its total assets and liabilities and not only the current ones. Still, because it is the current assets that are used first while paying off one's debts, check whether the company is able to cover its liabilities with them. If not, it means that it has to start selling out its fixed assets which may indicate serious financial trouble. The accounts listed on most of the company pages are updated annually which allows to monitor the company's net worth changes. A growing net worth is the primary sign of a thriving business. If a firm's net worth is bumpy, though, it may mean that the company is unstable so engaging in long term cooperation with it may be risky.
Another important indicator in the evaluation of a company's financial well being is the ratio of its net worth to its fixed assets. If the ratio is higher than 0.75, it means that the company holds too many fixed assets so it may not dispose of enough means to conduct its business operations. Such a company's position is unstable and it is prone to any changes on the market. Note, however, that the acceptable proportion of the fixed assets held by a manufacturing firm is higher than that of a service-based company which does not use so much equipment. Therefore, while estimating companies' situation, take into account the specificity of their branches.
Let us now take a look at the visual representation of the financial data of a company.
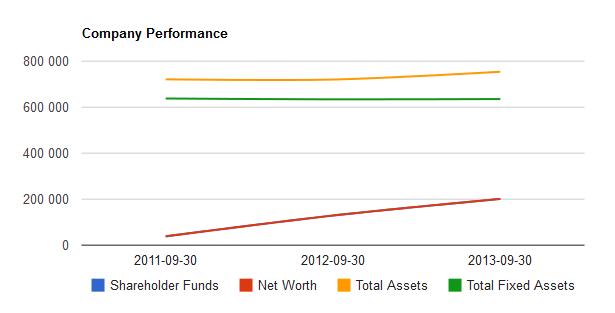
The above graph shows an economic cross-section of a fairly well functioning business. The Net Worth red line is ascending rather fast as the company's net worth increased by 200 000 GBP over two years. Another sign of the firm's good situation is the yellow line going slightly up. This means that the company is aquiring more assets. Next, although the fix assets comprise a rather large part of the total assets, the gap between them is growing slightly wider each year. That suggests that the company disposes of more and more current assets necessary to pay off debts or to conduct daily business operations. The relationship between the red and green line will be best explained on the basis of the firm's net worth and total fixed assets ratio. We can calculate it using the company's accounts:
The net worth : total fixed assets ratio calculated for the earliest accounts (from 30-09-2011) is: 637 814 : 38 360 = 0,06.
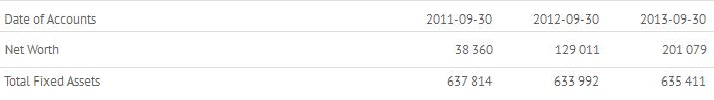
Since the result is below 0,75, it is a good ratio. The same ratio for the most recent accounts (30-09-2013) is around 0, 32. It is still a satisfying result, however, significantly higher than the one from two years before. This might be a warning sign for the company if they are providers of services which do not require many fixed assets, such as equipment, etc. On the other hand, if these were accounts of a construction firm, such an increase of their fixed assets could be interpreted positively. As for the graphic representation of these results, it is easy to see that the higher the net worth : total fixed assets ratio, the smaller the gap between the green and red lines. The decreasing gap can be interpreted as either a positive or a negative phenomenon depending on the particular numbers and the business's professional branch.
The next example illustrates the same economic tendencies of a heavily indebted company.
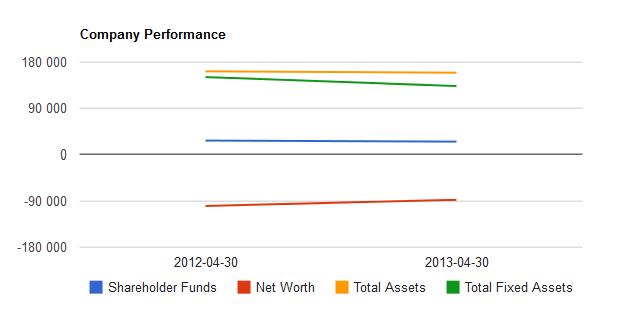
The first thing that attracts the attention of an analyst is that the red line is far below 0. This means that the company has more liabilities than assets. A net worth as negative as this one suggests that the company is going bankrupt and the situation is not changing much since all the line are in nearly perfectly horizontal alignment.
One more point in the interpretation of the financial data is calculating the ratio of a firm's liquid current assets to its current liabilities. If the resulting value is higher than 1, the company is able to pay off its liabilities due within one year. Such a company is perceived as strong and the higher the ratio, the stronger it is.
While assesing the company's financial situation, take into account also how much it is owed by its debtors. The mere fact that a company has debtors is nothing special since businesses selling expensive stock often accept payments by instalments. It is a bad sign, however, if the amount of the money owed to your company increases year by year. In such a situation, you may want to check if the company's liabilities to its creditors are also growing.
As for a company's shareholders, it needs to be noted that the funds received from them differ from those that the firm owes to its creditors in that they may but do not have to be paid back. Those which the company has to return are listed under the name of called up share capital. To check how burdensome this obligation is for the firm see if the business has already paid this sum in the line called up share capital paid. The profit and loss acoount reserve denotes the amount of money that remains after subtracting the total expenditures from the total profits of a company and this sum does not have to be paid back to the shareholders in the form of dividends. Finally, the allotted shares refer to those funds that were received from the shareholders and are distributed to particular purposes or underwriting companies.
Two more important aspects which can influence the interpretation of a company's accounts are depreciation and revaluation. Sometimes the estimated value of a company's assets included in the balance sheet under the name of tangible fixed assets cost or valuation is revaluated and it turns out to be higher or lower in reality. The difference between the old and the new value of a company's fixed assets can be found in the line "Tangible fixed assets increase decrease from revaluations". Revaluated assets are added to the balance sheet but note that revaluation reserves, which comprise the surplus of all the evaluated assets, are not included in the company's real capital. The other term, depreciation, refers to the part of assets' value that has already been consumed. It means that the actual worth of a company's assets may be higher than that which is reported.
Concluding, while interpeting the financial section of BizDb's company pages, keep in mind the most important clues. The company's net worth value and growth are the primary indicators of its economic situation. The company's solvency can be assessed, for instance, on the basis of the ratio of its liquid current assets to its current liabilities. Finally, note that depreciation and revaluation may affect the numbers in the balance sheet.
If you liked this article, why not share them with the world? Tweet, share on Facebook or give us a plus one. Thank you.